
FINANCIAL TOOL
PEG Ratio
You may have heard of the Price-to-Earnings (P/E) Ratio, but some analysts prefer to take this ratio one step further.
The PEG ratio incorporates growth projections to the mix. Technically, it’s the Price/Earnings-to-Growth Ratio. This equation attempts to measure risk-adjusted performance for an investment.
Here’s the formula for those who enjoy detail:
PEG Ratio =
Price/Earnings
Forward Growth Rate
The logic of the equation is this.
Any result less than one, a stock is considered to be undervalued.
Any result greater than one, a stock is considered to be overvalued.
Members of the CFA Institute recently examined the usefulness of this ratio by examining S&P 500 data from 1985 to 2020, using Yardeni Research’s P/E Ratio data (shown below).
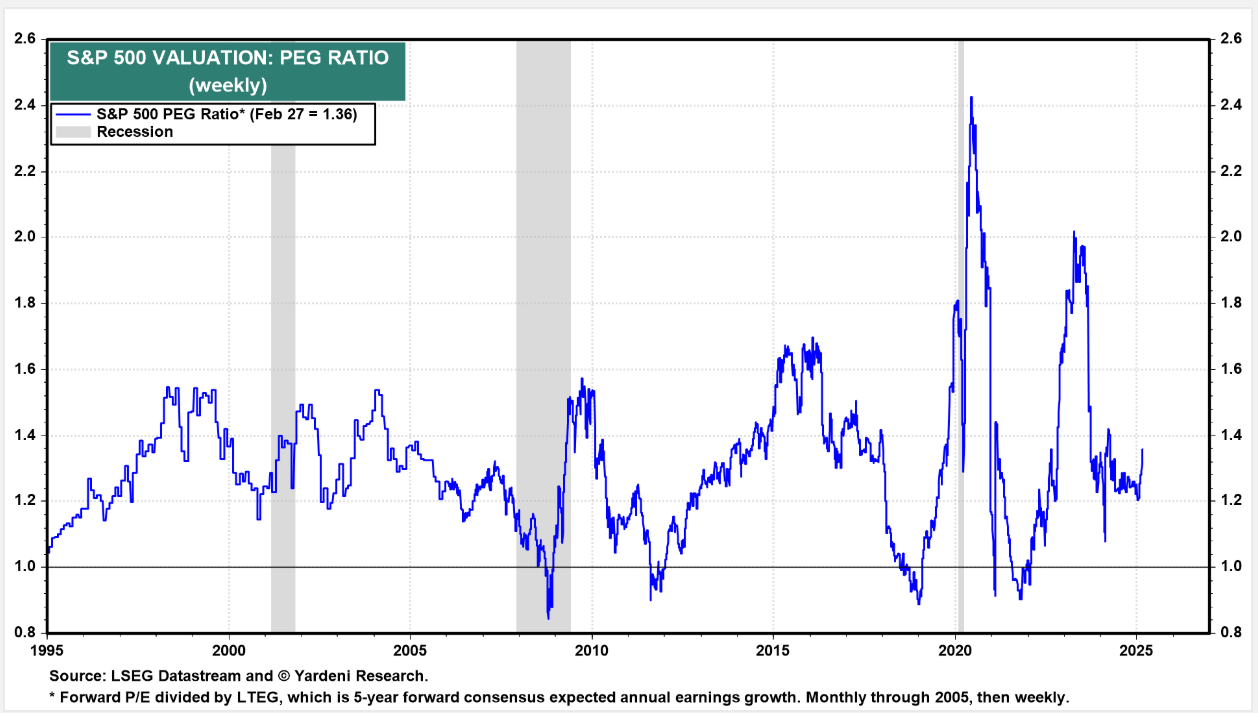
The glaringly obvious fact is that a PEG less than 1 is a very rare occurrence.
While buying when the PEG is below 1 may offer some likelihood of positive upside movement, selling when it is above 1 doesn’t offer any clear benefit.
Even different PEG levels, whether low or high, did not give clear and consistent return predictions for future markets.
Sometimes markets did far better with higher PEG ratios, and other times they did far better with lower PEG ratios. And sometimes market returns were fairly equal whether markets were above or below 1 on the PEG ratio.
The conclusion on this matter is that the PEG ratio tends to be more reliable when applied to individual stocks rather than to the stock market as a whole. And, like most financial ratios, it’s not very useful without other supporting data.
Better to be invested through thick and thin rather than wait for the whole stock market PEG ratio to drop below 1.
But if you’re going to use it as a timing tool for the broader stock market, it’s better to use it as a buy signal rather than a sell signal.