FINANCIAL TOOL
Shiller’s P/E Ratio
You may have heard the term price-to-earnings ratio.
It gets touted all the time as being a kind of indicator of whether stocks are high or low.
But did you know that there is virtually no evidence that P/E ratios are predictive of where stocks are headed? Yet the fact that most investors focus on this ratio reveals how easily the illusion of meaning can creep into investment strategy.
The problem with standard P/E ratios is that price tells us what investors expect companies to make over the next several years, while the earnings tell us what companies made last year.
If there is evidence that earnings will be sustainably higher in the future, then P/E ratios may be high for good reason!
But there is also a modified P/E ratio created by Robert Shiller.
This attempts to make the ratio more meaningful by using the average earnings for the past ten years. This is obviously quite different than using just last year’s earnings for the denominator. To top it off, he adjusts these earnings over the past ten years upward based on inflation that has happened since that time.
This helps to smooth out the chart and take a more long-term view of how prices today compare with prices of the past, smoothing out less-meaningful temporary spikes that could be misinterpreted.
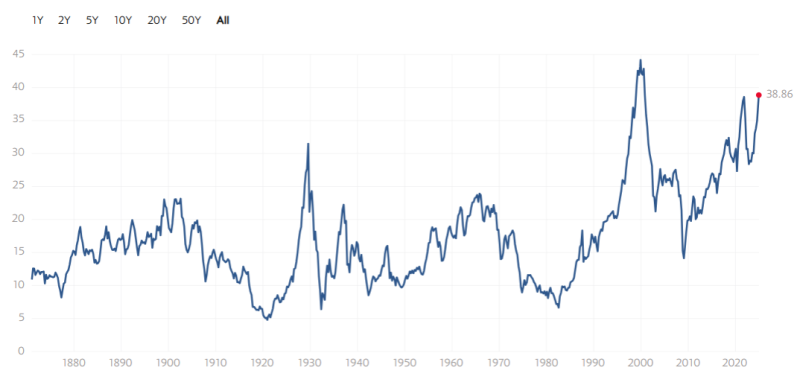
Currently the Shiller P/E ratio is at approximately 38, the highest that it’s been since Oct 2022. Before that, it was above 38 from Oct 1998 – Oct 2000. We have a very small sample size, so while it appears to have some predictive power, we still don’t have enough evidence to make this conclusive.
The question some have raised is, why should earnings from ten years ago have any predictive power of where stock prices go from here? It’s a good question.

Source: https://www.multpl.com/shiller-pe
At most, it appears to have some predictive power of long-term average returns over 10-20 years.
But just like standard P/E ratios, it has no known predictive power for what stocks will do in the short-term.
So this is not a tool to confirm when the market has peaked, but it is an indicator that helps weigh the likely risk/reward tradeoff in the long run.
If we’re not willing to take on the full market risk while future long-term rewards appear likely to be lower than average, then we can use strategies such as holding put options on our current assets, Defined Outcome ETFs, adding bonds to the mix and/or selling covered call options to reduce downside risk.
