
NEWS
What Happened This Week
On February 19, the S&P 500 closed at $6,144.15.
On April 7, it opened at $4,953.79.
The difference between these two points is $1,190.36, a total of a 19.37% drop. Just a hair away from a bear market.
Here’s why this matters.
Technical analysis (using historical charts to spot patterns and predict the future) is not a scientific or greatly reliable way of timing the market by itself. But because so many investors believe in patterns, it can generate a sort of self-fulfilling prophecy that’s somewhat reliable in predicting very short-term moves.
In a vacuum, don’t use technical analysis for market timing. But if it’s part of your overall analysis, which includes more fundamental data, it can be a useful element of the strategy,
So here’s what I see approaching.
Fibonacci numbers are found everywhere in nature, from spiral galaxies to the ratio of the human body, from pinecones to sunflowers, and even the number of petals on flowers.
What is a Fibonacci number?
It’s a progression of numbers determined by the sum of the two numbers that came before it. Like this:
0, 1, 1, 2, 3, 5, 8, 13, 21, 34, 55, 89, 144, 233…and so on.
See it?
0+1=1, and 1+1=2, and 2+1=3…
Notice that dividing the previous number by the following number becomes closer and closer to equaling 0.618.
1 / 2 = 0.5
13 / 21 = 0.619
144 / 233 = 0.618
So 0.618 is considered the “Golden Ratio,” and some investors believe so strongly in this that they use it as a floor or a ceiling.
Back to the recent market drop.
If we take the total $1,190.36 that the S&P 500 dropped, and multiply that by 0.618, we get $735.64.
Now we can do two things: subtract this number from the high point and add it to the low point.
1) Subtract $6,144.15 – $735.64 = $5,408.51
2) Add $4,953.79 + $735.64 = $5,689.43
These are two places where the markets will very likely encounter at least some degree of resistance before crossing above or below.
The problem is that the 50-day moving average recently intersected with the upper level of $5,689.43. This makes the level particularly difficult to breach in the next few days. Right now, fortunately, the market price is above the lower level of $5,408.51.
So it’s in between the levels.
I’m enjoying the beaches of Florida right now (and not at my computer), so my chart below is from Tuesday instead of Friday before the price point crossed above the lower Fibonacci level, but it still illustrates the point:
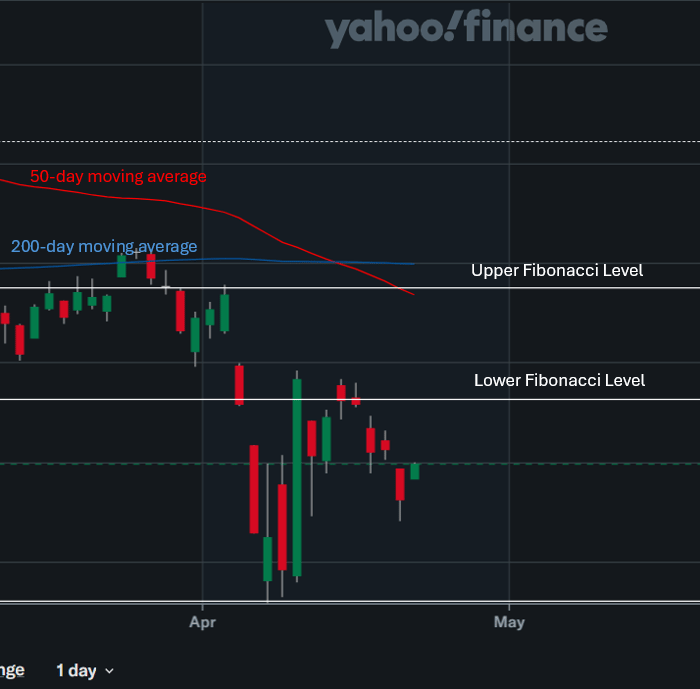
Source: Yahoo Finance
The 50-day moving average has been declining by an average of 15 points per day, which if that continues, could even cross with the lower $5,408.51 level after about 3 weeks of trading (given similar market environments going forward).
If we don’t get good upward movement in the next three weeks, I think the chances of a more extensive downturn tick higher.
But the good news is that markets experienced a solidly positive week, with the S&P 500 climbing 4.59%. And the Fed still has room to cut interest rates several times over the coming months and even years. They have the chance to do something during the May 6-7 meeting.
If they cut rates, even slightly, they could help shift the momentum before it becomes too engrained to save from a bear market. But the Fed has to be careful not to raise expectations of inflation at the same time. It’s a tricky situation for them without an obvious solution, but in my opinion, I think a 25 bps cut in May would be prudent.